


Trading Master Guide: Support and Resistance
A complete guide to support and resistance in trading—learn how to identify key levels, understand market psychology, and improve your entries and exits.
Most traders hear about support and resistance early on, but few actually learn how to use them well. If you’ve ever been confused about how price reverses from certain key levels, this guide will clear that up.
What is Support and Resistance in Trading?
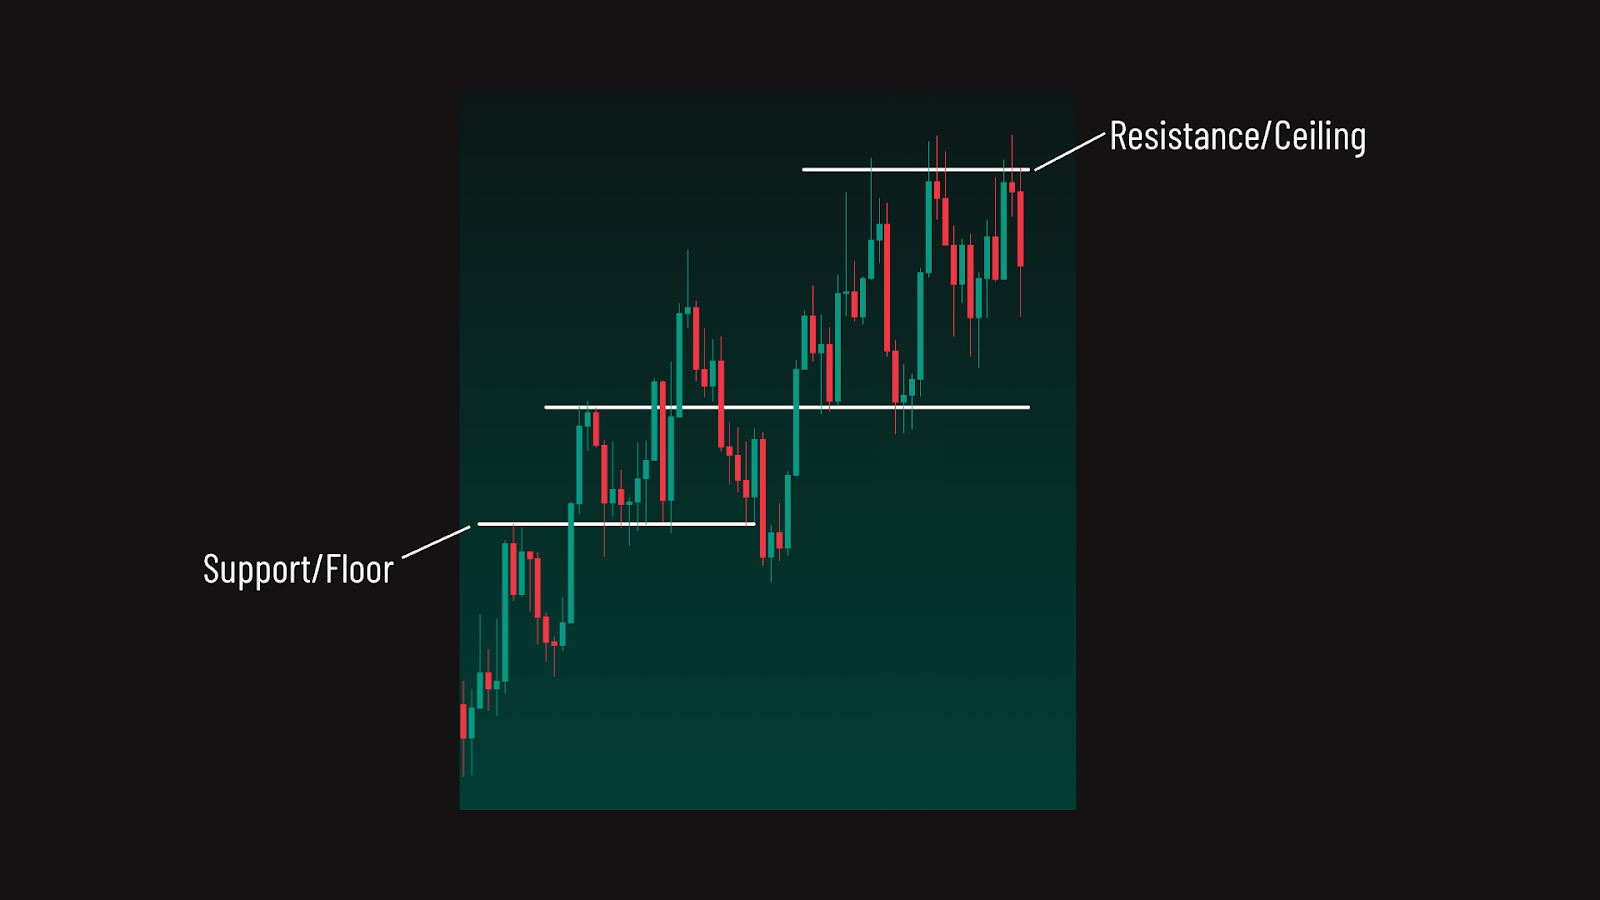
Support and resistance are key price levels where the market tends to pause or reverse. A support level is an area where price often stops falling because buyers step in. A resistance level is where price often stops rising due to selling pressure.
These levels are often referred to as floor and ceiling or even demand and supply zones. They are not exact prices, but rather areas where reactions have historically occurred or are likely to occur.
Understanding Market Psychology
Support is a price area where a lot of traders think the market is ‘cheap enough’ to start buying again. It’s where price has reacted before—usually by bouncing back up.
Resistance is the opposite—it’s a level where price has turned back down in the past, because many previous buyers have begun selling for a profit. Buyers were also less likely to step in as things were getting expensive.
These areas matter because they show where the market has made decisions before. If price reacted strongly in these areas before, it might do it again. That’s why traders watch these zones closely and often use them as places to enter or exit trades.
How to Identify Support Levels
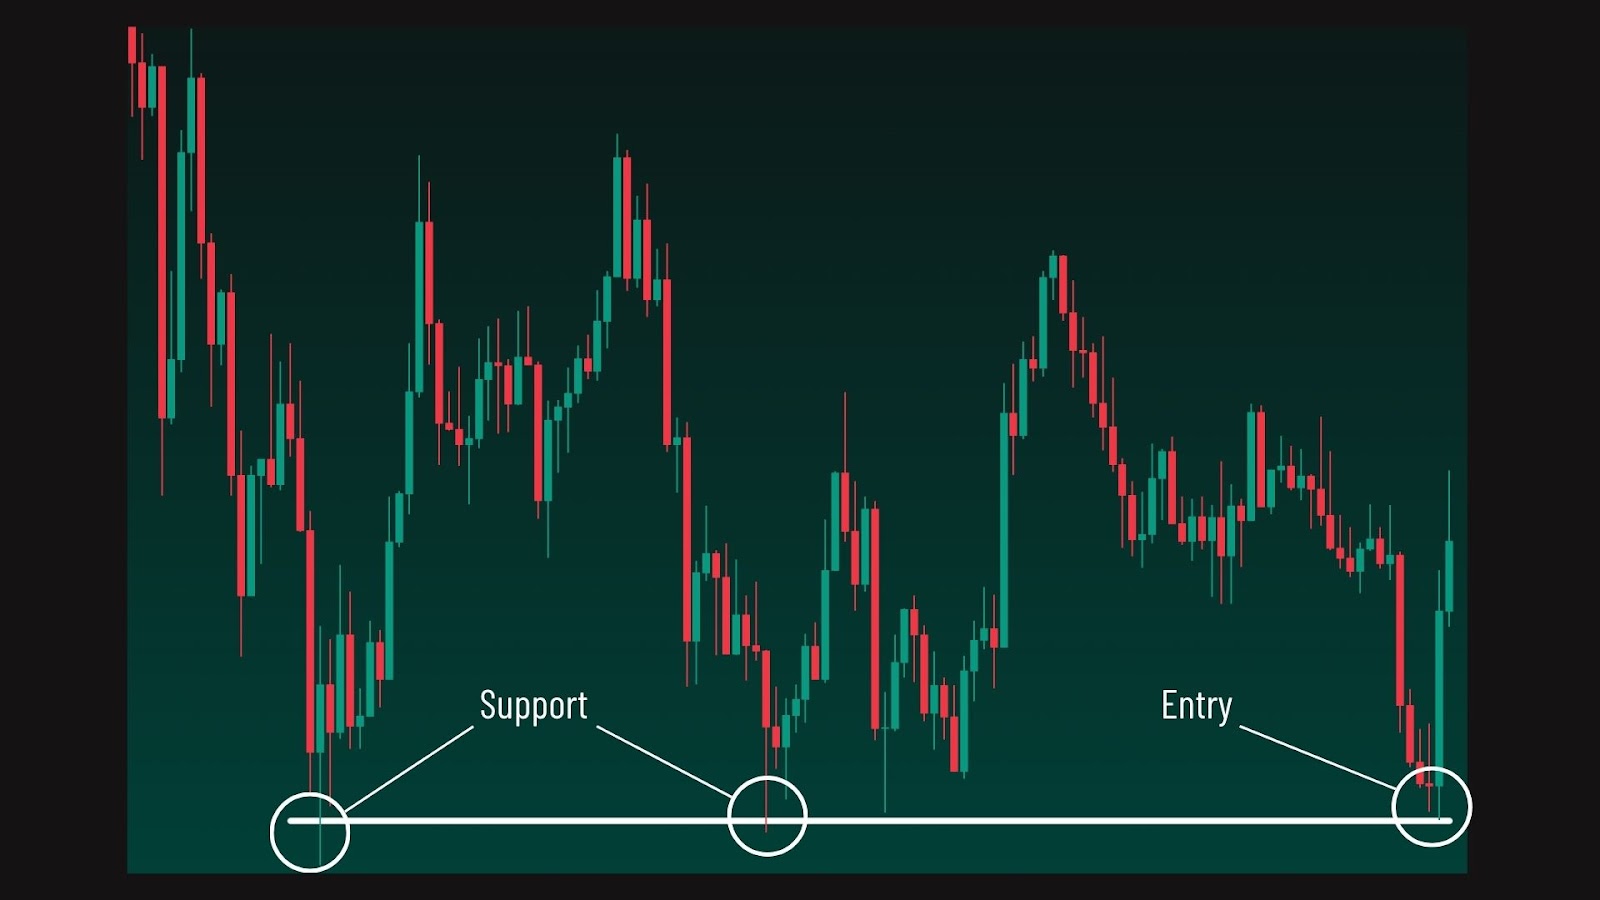
One simple way to find support is to look for areas where price has reacted to the same level more than once in the past.
This is known as using naked price structure, and you can spot it by drawing clean horizontal lines across previous highs or lows — where price clearly made a pivot.
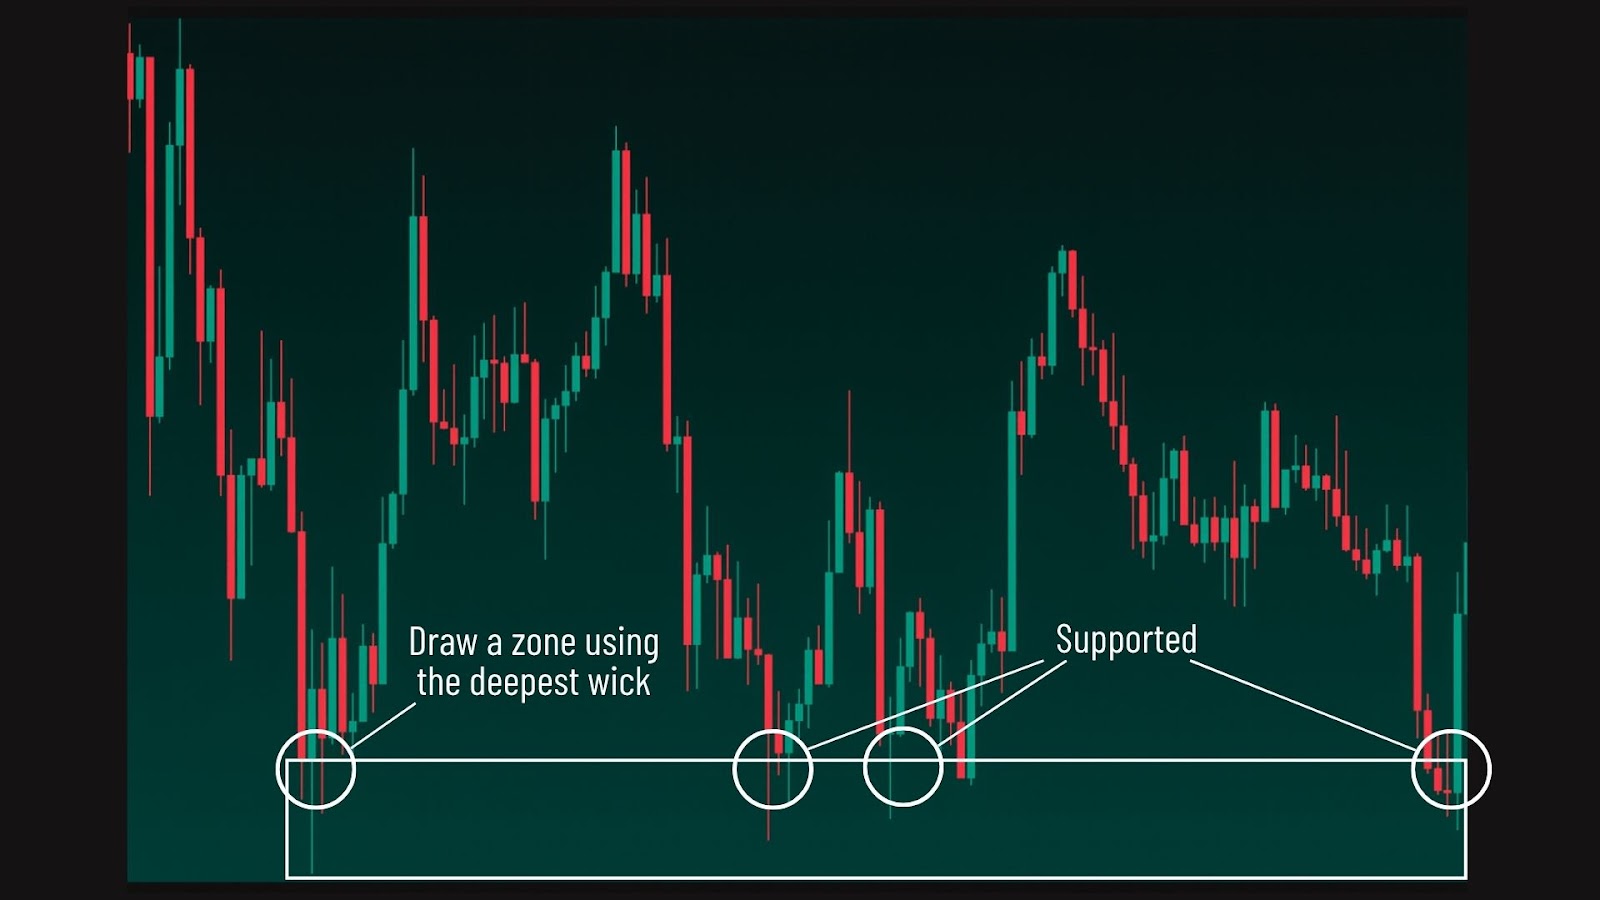
Another method is to identify zones instead of exact levels. This gives you a bit of a buffer area rather than a single price point.
Wicks of candles are often a useful choice—those thin lines above or below the candle body—because they often show where buyers stepped in strongly and pushed price back up. This implies a higher likelihood for buyers to step in once again if price revisits those wicks.
Keep in mind that this isn’t the only way to mark support. Some traders use more advanced tools like Order Blocks, a part of a new approach to trading called Smart Money Concepts (SMC). But if you’re a beginner, learning to read raw price reactions is the best place to start.
How to Identify Resistance Levels
To spot resistance, look for areas where price struggled to move higher and turned back down. These are often visible as previous highs that were followed by a noticeable drop. Drawing a horizontal line across these highs can help you mark potential resistance.
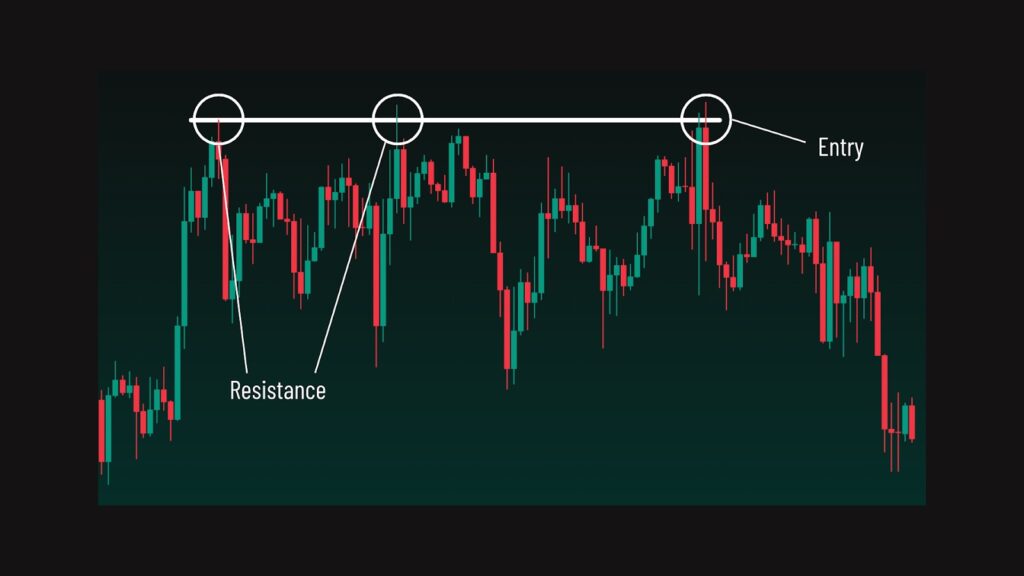
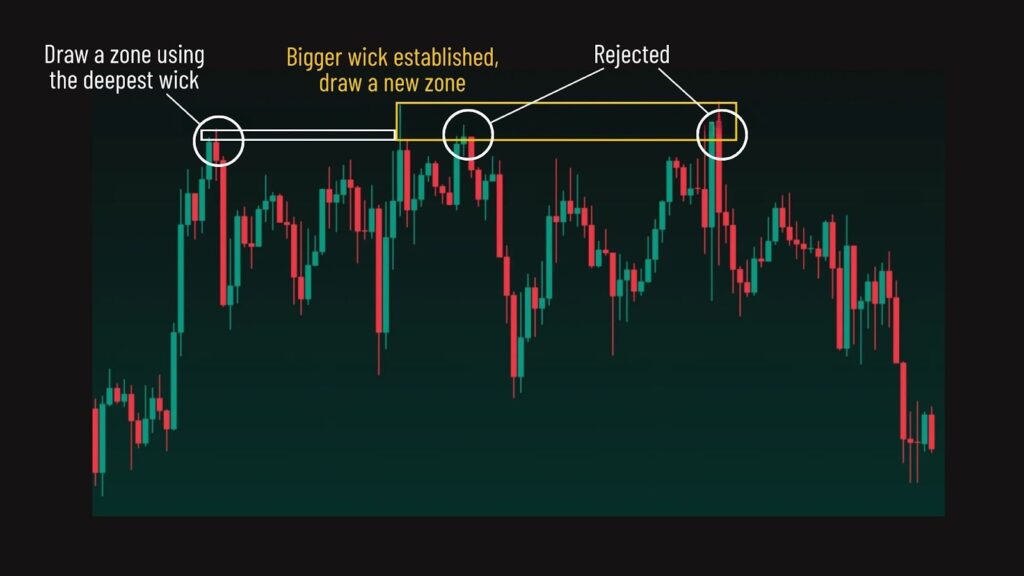
Unlike support, which is about buyers stepping in, resistance shows where sellers become active. This can be a single level or a wider zone where price stalled a few times. When price keeps failing to break above a certain area, that area becomes more significant.
You’ll often notice candle wicks poking into a resistance zone but then quickly pulling back. This is a sign that buyers tried to push higher but sellers won the fight. It’s a good visual clue that the area is still being defended.
Key Note: Support and Resistance Can Switch Roles
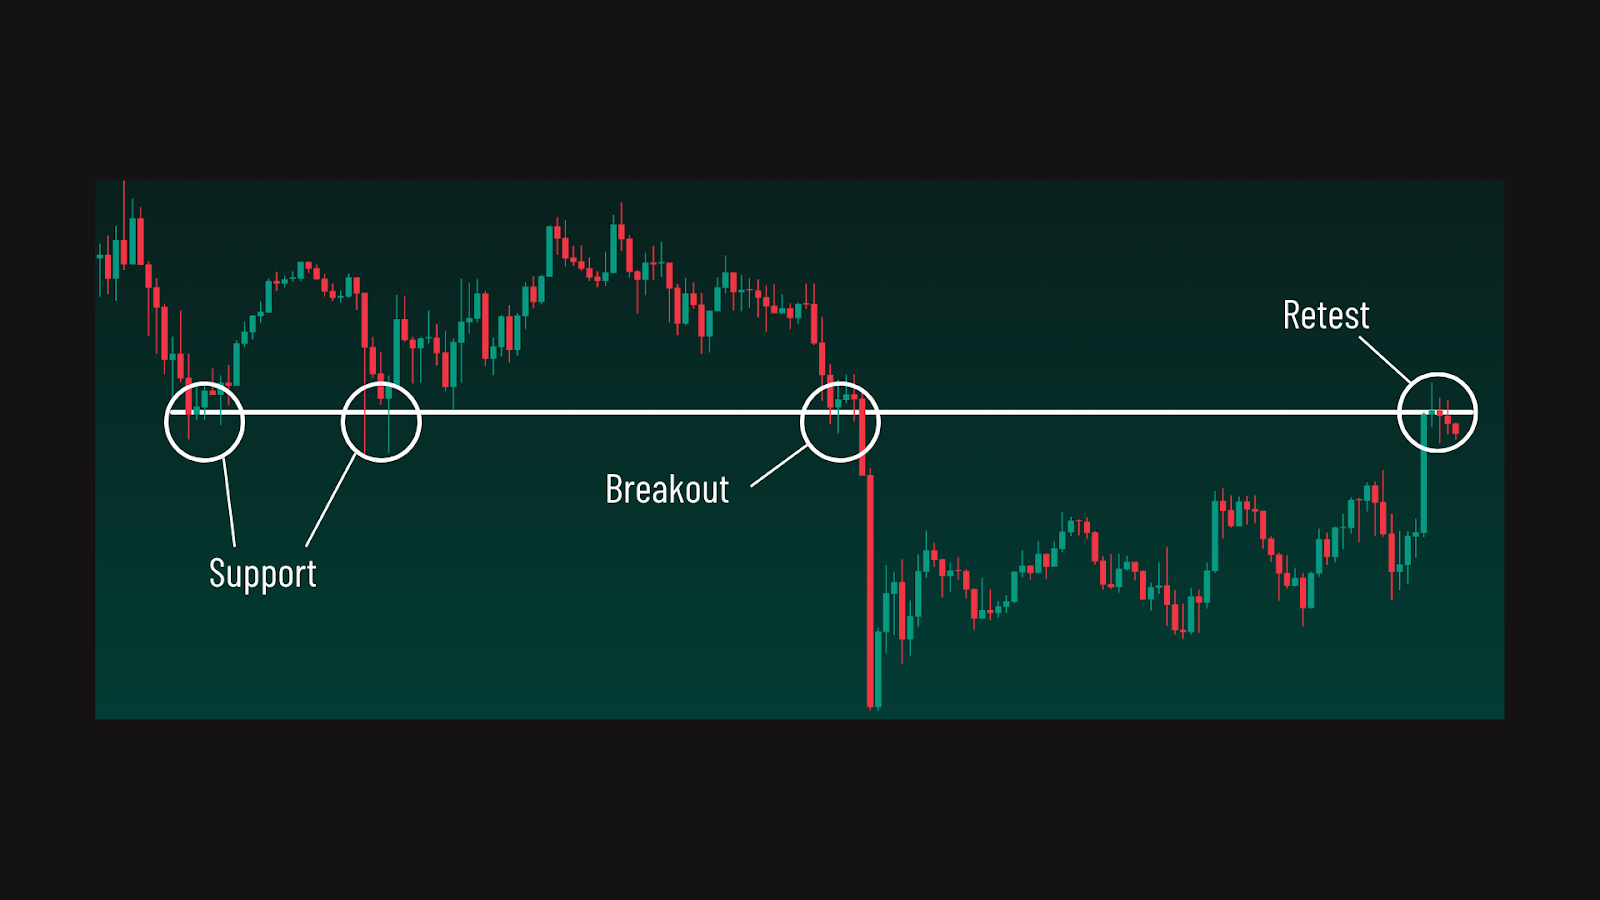
What previously was support can become resistance. And the reverse principle is true: resistances can become support levels.
A break from these previously “respected” levels — as in price has typically pivoted away from them — shows the market’s intent to reprice. Therefore, it is significant when a support or resistance breaks.
It demonstrates a potential shift in market sentiment, especially if that specific level has held for a longer period of time — especially if it spans for days, weeks, or even months.
Dynamic Support and Resistance
Support and resistance don’t always show up as flat, horizontal lines. In fact, price often reacts to levels that move over time—these are known as dynamic support and resistance.
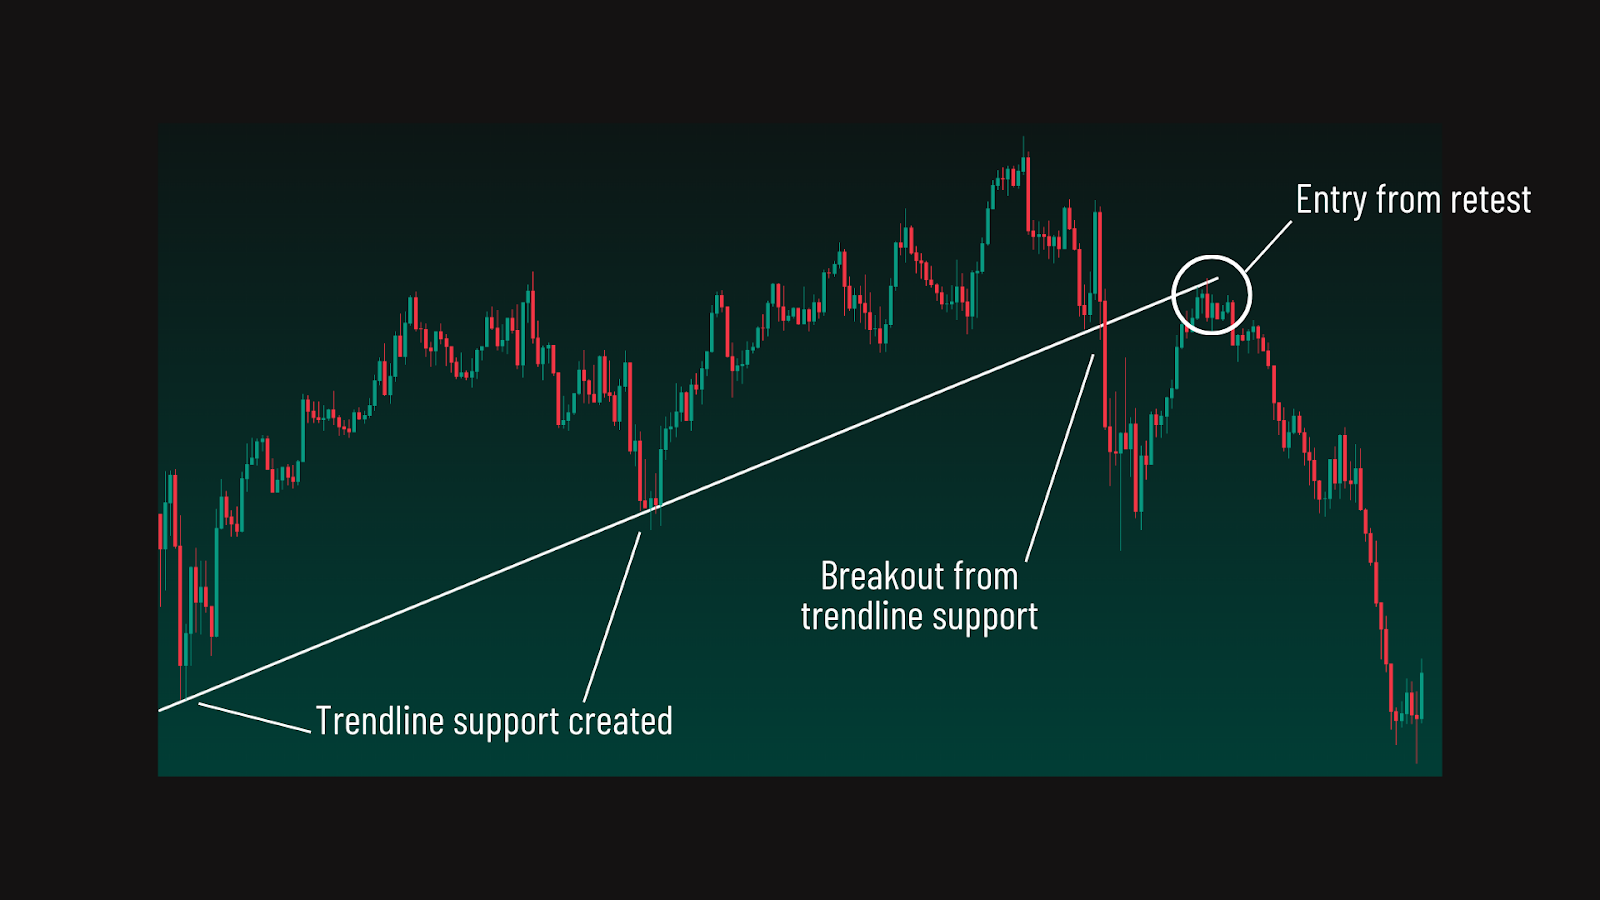
A good example is a trendline. When price is moving in a consistent direction, you can draw a diagonal line that connects the swing lows (in an uptrend) or swing highs (in a downtrend). These lines act like sloped support or resistance and can guide future reactions.
Dynamic levels are useful because they adjust as price evolves. That means they can continue to provide guidance even as market conditions change.
Common Support and Resistance in Technical Analysis
| Pivot highs and lows | Swing points where price has temporarily reversed. Useful for spotting market turn zones. |
| Chart pattern necklines | Levels that form the boundary of patterns like head and shoulders or double tops/bottoms. |
| Fibonacci retracement levels | Key zones based on Fibonacci ratios that can act as pullback or continuation areas. |
| Prev. day/week/month highs/lows | Historically significant levels watched by many traders for potential price reactions. |
Final Thoughts on Support and Resistance
Support and resistance are foundational to nearly every form of technical analysis.
Here’s a quick overview:
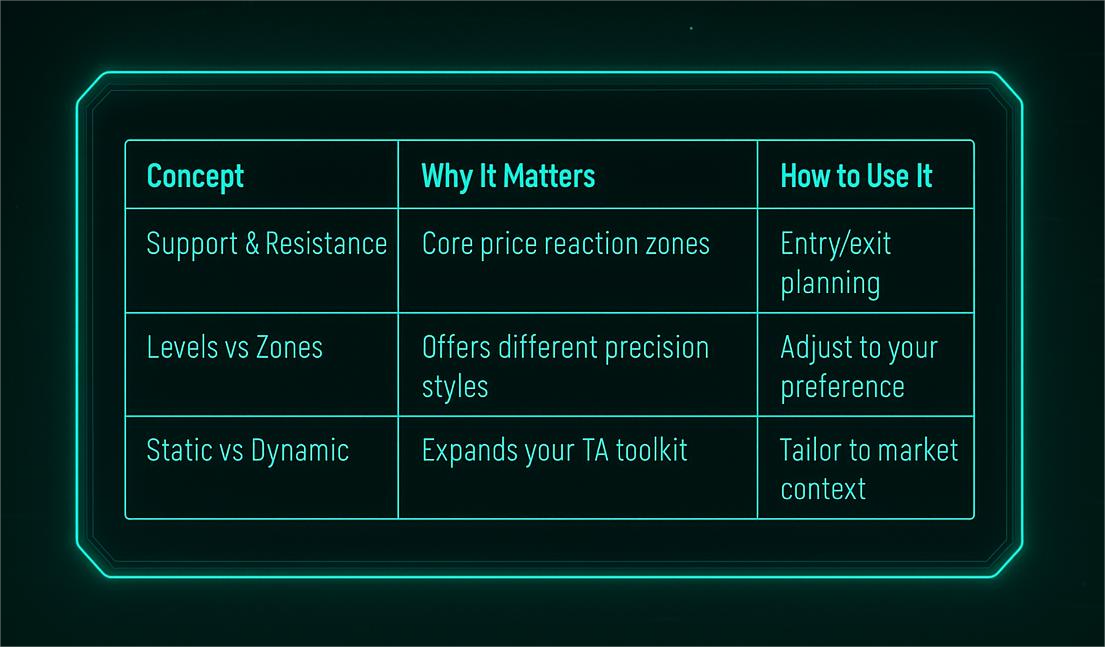
Understanding how to use support and resistance can transform the way you see price action. It’s a fundamental skill that gives structure to every trade decision—and it’s one of the first concepts serious traders master.
FAQ
How do I identify strong support or resistance zones?
Look for price areas where the market has consistently reversed direction. These are strong levels. The more times price reacts to a level without breaking it, the more significant it becomes.
What is the difference between a support level and a demand zone?
A support level is a single horizontal price line where price has previously bounced. A demand zone, on the other hand, is a wider area that captures the entire region of buying interest. Zones are often more useful than lines because they allow for a margin of error and reflect how price often reacts within a range, not a specific point.
Can support become resistance and vice versa?
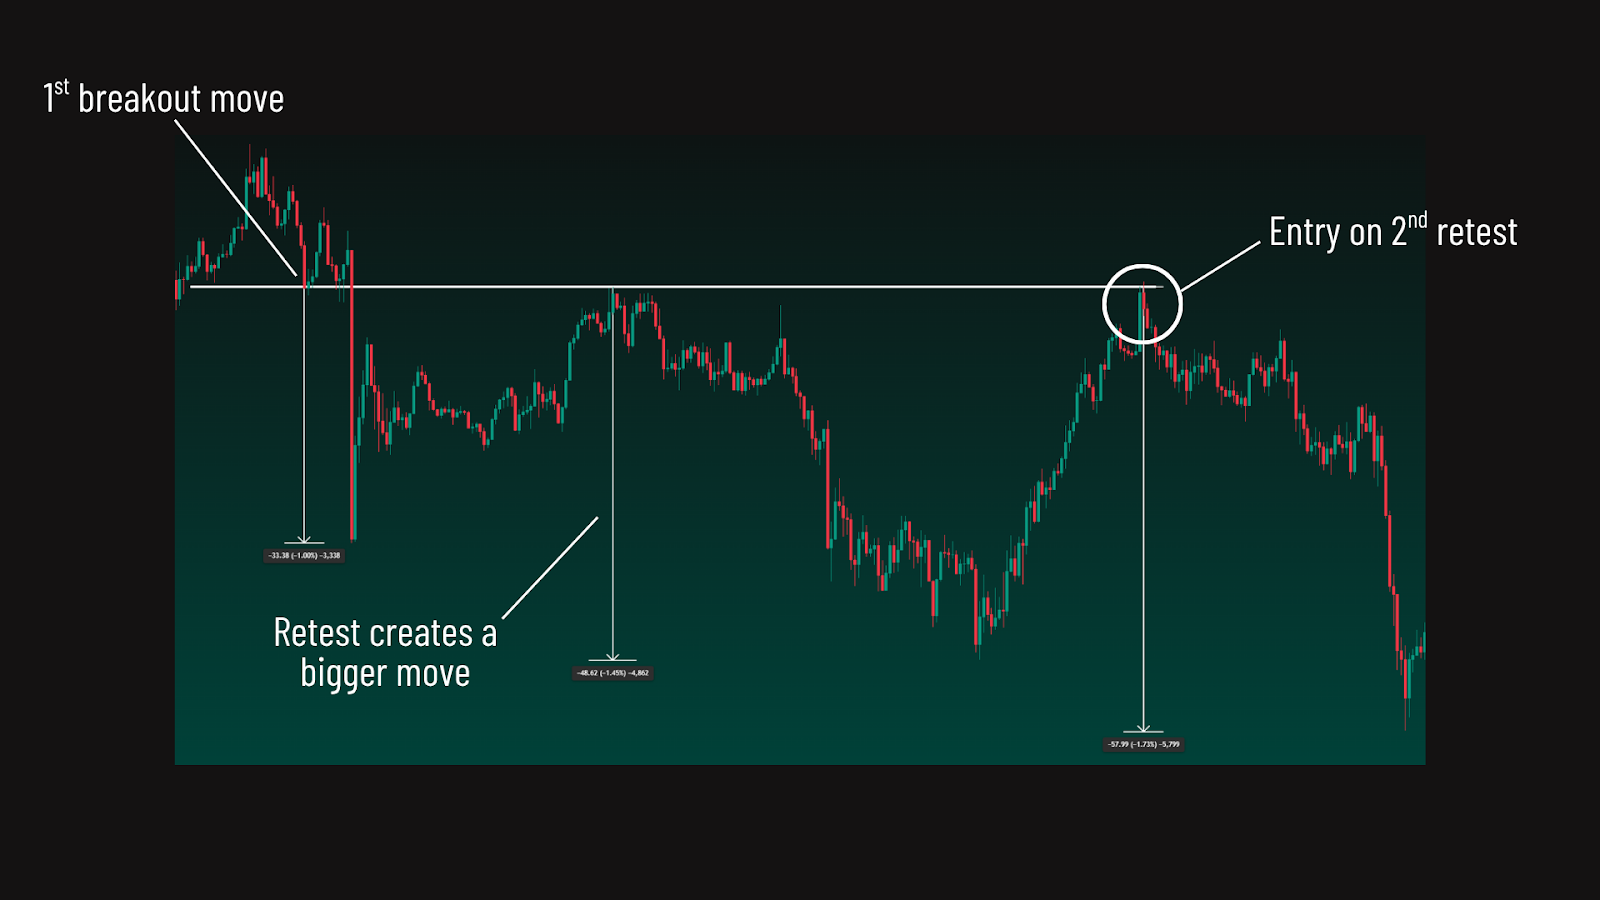
Yes, when price breaks below a support level and then comes back up, that same level often acts as resistance. The same goes in reverse: if resistance is broken and price pulls back, the level can become support. This happens because traders who missed the first move will enter on the retest, reinforcing the new direction.
What is dynamic support and resistance?
Dynamic support and resistance are levels that adjust as price moves. Unlike horizontal levels, these follow trends and include tools like trendlines, moving averages, and channels. They’re useful in trending markets because they follow price action and help traders find potential reaction areas even when price is making new highs or lows.
Are wicks or candle bodies better for marking zones?
It depends on your trading style. Wicks often show the true extremes where price was rejected, making them great for marking precise entry points or scalping. Candle bodies, however, show where most of the trading occurred and can offer more stable zone boundaries. Some traders use the wick for entries and the body for confirmation.
Do all traders see the same support and resistance levels?
Not exactly. While many traders draw similar levels, especially on major highs, lows, or psychological price points – support and resistance is subjective so different traders may mark levels differently. However, the more a level has been respected in the past, the more likely it is that others are paying attention to it, which can reinforce its importance.